RemitSCOPE Africa
RemitSCOPE Africa compiles the most-up-to-date and trusted remittance and remittance-related data across 54 countries in Africa.
RemitSCOPE Africa provides data to better understand remittances across the continent, gather insights into diaspora, remittances flows, pricing, operating environments, digitisation, access and much more.
Choose your topic
Explore data by theme
and indicators
Compare
Indexes
Deep dive into
Country profiles
Review insights
& analysis
Remittances to Africa
What’s happening
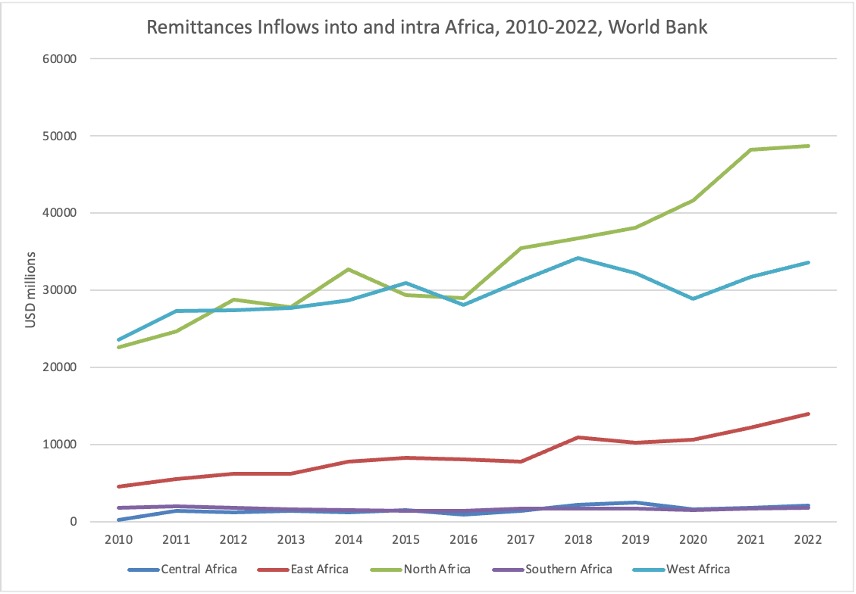
In 2022 remittance inflows into Africa totalled an estimated USD100.1 billion, accounting for 3.4% of Africa’s total GDP
In 2022, according to the World Bank, nearly $100.1 billion flowed into Africa in remittances which is approximately twice the level of overseas development assistance. Remittances provide a lifeline for many families and countries, especially in rural areas where they can make the biggest difference. Within Africa, 17 of the 54 countries are dependent on remittances for at least 4 per cent of their GDP.
Explore the Remittances Dashboard to learn more about remittance inflows and outflows into Africa by country and at a corridor level.
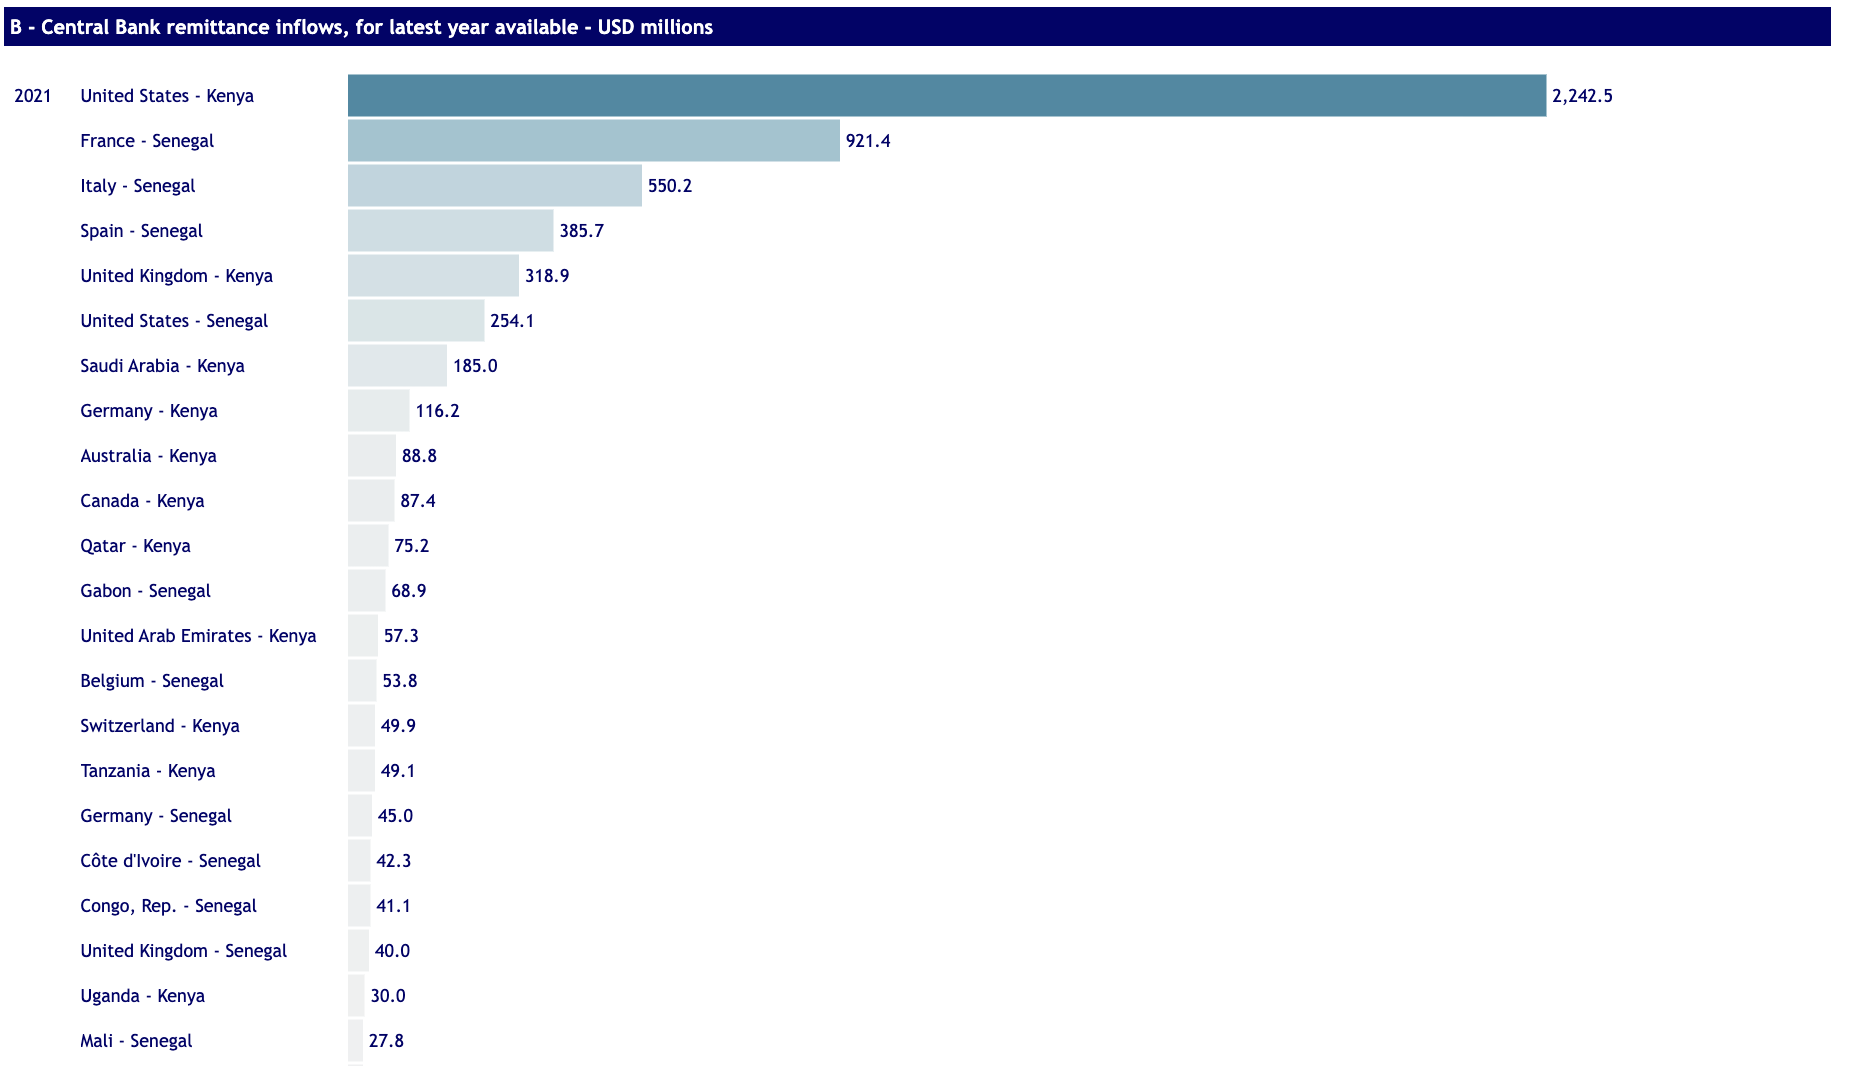
RemitSCOPE compiles the first bilateral remittance matrix of corridor-level data published by Central Banks
Central Banks across Africa are committing to improving the quality and availability of remittance data. This is a response from policy makers, regulators, and industry for Central Banks to provide better quality remittance data at a more disaggregated level.
RemitSCOPE compiles and shows remittance inflow and outflow data published by Central Banks, broken down at a corridor level. There are currently four countries in Africa that are publishing remittance data broken down by corridor; these are Ethiopia, Kenya, Morocco and Senegal.
As Central Banks provide remittance inflow and outflow data broken down by the type of institution sending the payment or channel received, RemitSCOPE, as the home to remittances data, will publish this information through additional dashboards and market insights.
Explore the Central Banks’ remittances data by corridor on the Remittance Dashboard.
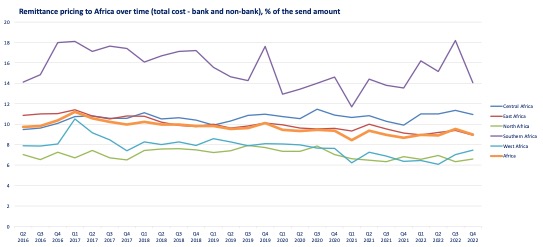
Africa is the most expensive region in the world to send money to, with an average price of 8.9 percent to send $200 in Q4 2022
According to World Bank data remittance prices fell from 11.55 per cent in Q2 2014 to 8.85 per cent in Q4 2022, a drop of 2.7 percentage points. At this rate of progress Africa will fail to meet SDG 10.c which states that remittance prices will not average more than 3 percent by 2030 and no single corridor will be more than 5 percent.
The prices for sending to and within Africa vary significantly depending on the region and channel used. In Q4 2022 it cost 14.1 per cent to send to Southern Africa compared to 6.5 per cent to send to Northern Africa and 7.1% in West Africa. Whilst it is significantly over the SDG 10.c target to send to all regions of Africa it is important to understand there are major differences between regions.
Explore the Remittance Pricing Dashboard to learn more about remittance costs into and out of Africa by country and at a corridor level.
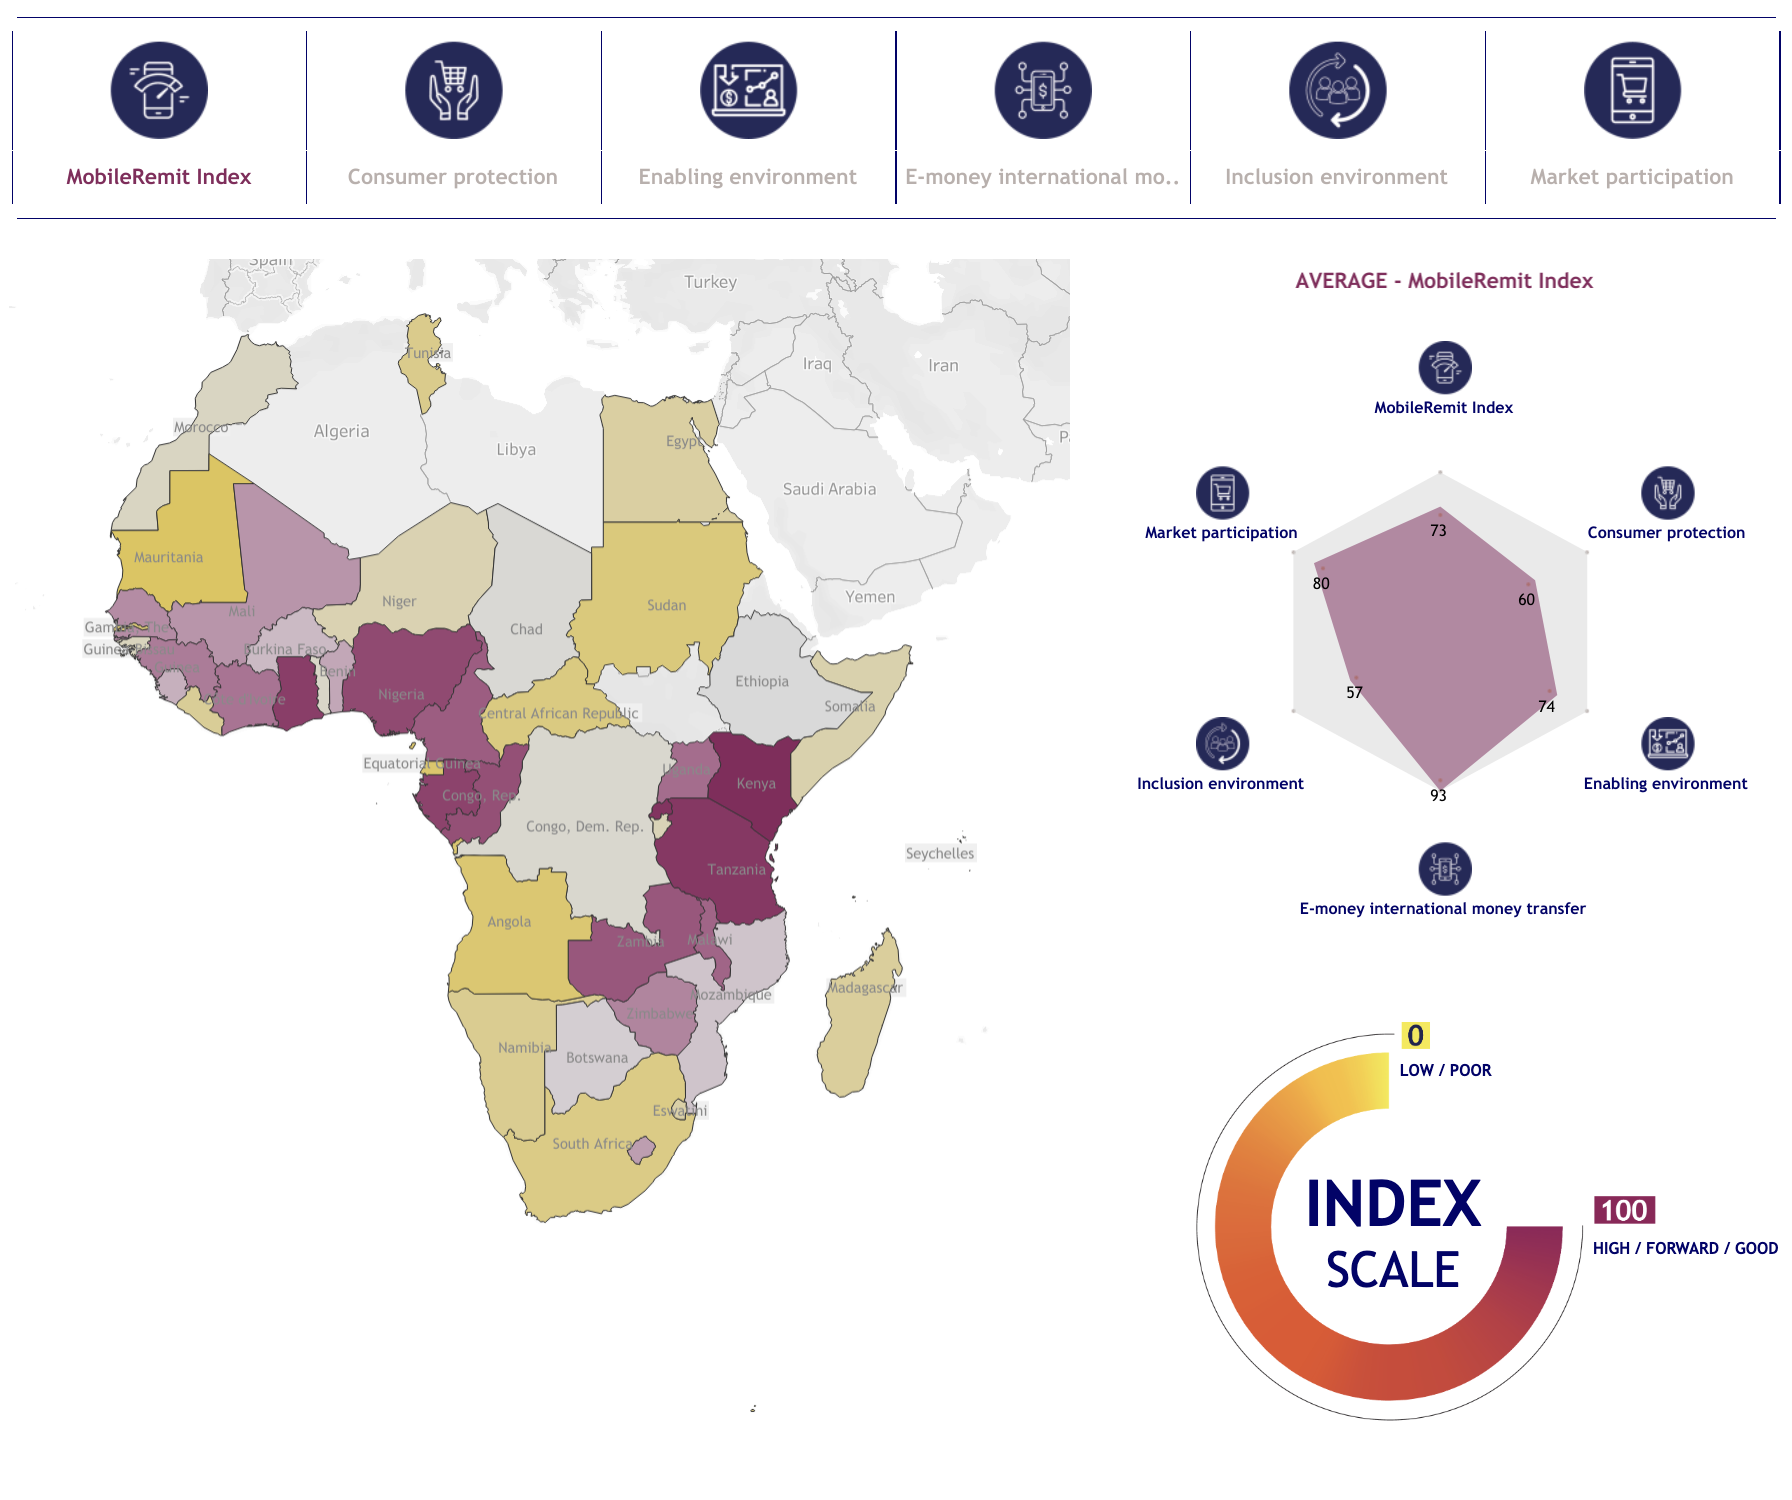
The MobileRemit Index score tells a relatively positive story for the preparedness of African countries to take advantage of the growing digitalization of remittances
Almost half of all countries (49 per cent) in the index achieved the highest scores of 80 per cent or more, with 80 per cent of countries securing a medium score (60-80 per cent) or higher.
Overlaying these scores onto a map of Africa, the higher index scores appear generally clustered around the mobile money strongholds of East and West Africa. Mobile money wallets are the most likely digital channels chosen by users to receive remittances in these countries.
East Africa has been the traditional home of mobile money for over a decade now and it is perhaps no surprise to see Kenya achieving the top index score (97) with nearby Rwanda (92) and the United Republic of Tanzania (90) also attaining high scores. Taking all East African Community (EAC) countries together their average scores for all index pillars are higher than the continental average.
Explore the the Indexes Dashboard through the Snapshot Indexes and MobileRemit Index.
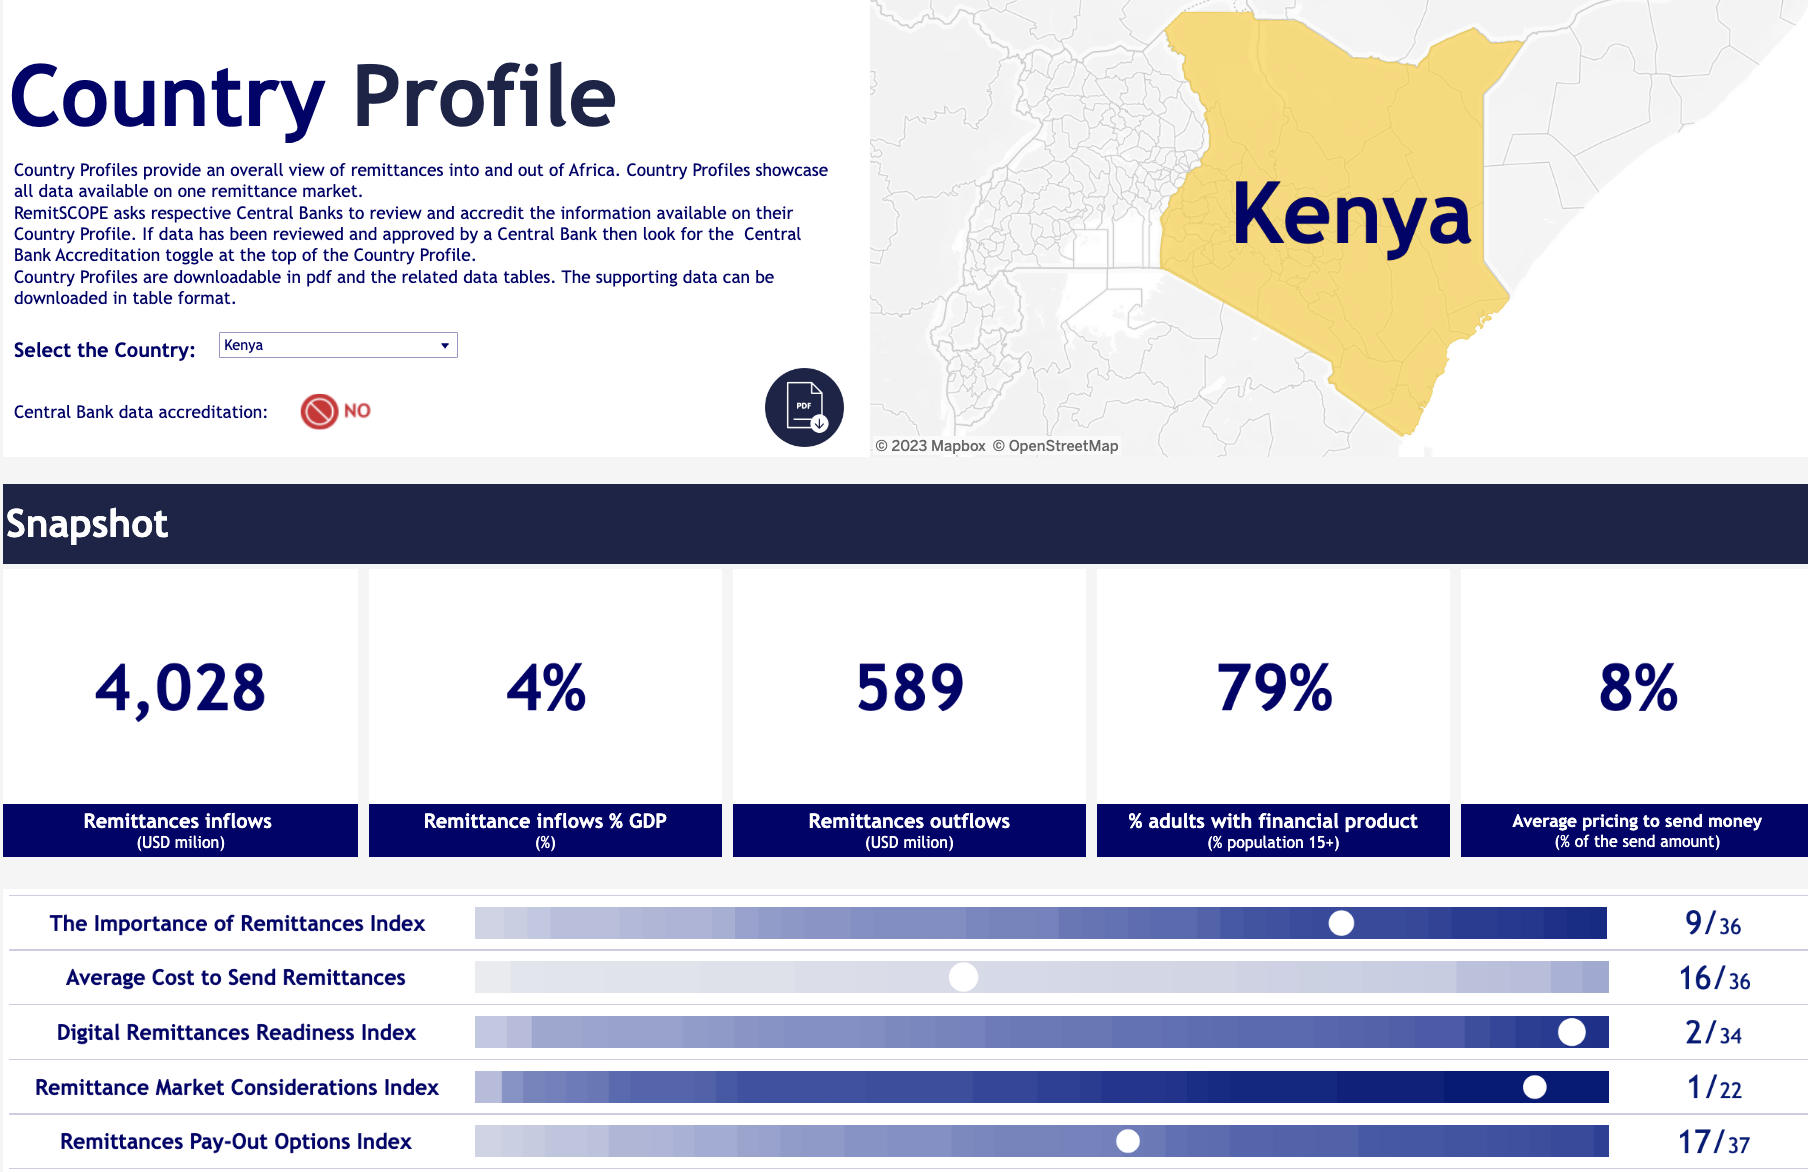
Kenya is a net inbound remittance market, receiving just over US$4 billion in 2022, and ranking 6th in Africa in the Importance of Remittances Index
Kenya is a net inbound remittance market, receiving just over US$4 billion in 2022 ranking 5th in Africa (with the United States and the United Kingdom as the main sending markets), compared to outflows at US$509 million (2022). Remittances account for nearly 3.4 per cent of gross domestic product (GDP) and are a leading source of foreign exchange in the country.
The Central Bank of Kenya (CBK) is taking a leading role on the continent and currently collects and publishes total remittance inflow data in US$ on a monthly basis, broken down by corridor. It also publishes an annual report with a summary of the sector’s performance. The CBK launched the publication of the Diaspora Remittances Survey and existing plan to undertake National Remittance Household survey by 2023.